

Giao dịch
Khám phá đa dạng thị trường với mức giá cạnh tranh, thanh khoản sâu và các công cụ giao dịch tiên tiến.
Tìm hiểu thêm 
Nền tảng
Giao dịch mượt mà với nền tảng mạnh mẽ của TMGM, được xây dựng để đảm bảo tốc độ, độ chính xác và trải nghiệm giao dịch vượt trội.
Tìm hiểu thêm Nền tảng Giao dịch
Công cụ Giao dịch
Học viện
Học các kiến thức cơ bản về giao dịch với các tài nguyên thân thiện cho người mới bắt đầu, bao gồm hướng dẫn, hội thảo trực tuyến và nhận định thị trường.
Tìm hiểu thêm Học viện TMGM
Tin tức & Phân tích
Nhận cập nhật thị trường theo thời gian thực và phân tích chuyên gia để luôn dẫn đầu các cơ hội giao dịch
Tìm hiểu thêm Tin tức & Phân tích
Giới thiệu
Tìm hiểu điều gì làm nên sự khác biệt của TMGM — sự hiện diện toàn cầu, sức mạnh quy định và cam kết đổi mới trong giao dịch.
Tìm hiểu thêm Tại sao chọn TMGM
USD/CHF Price Forecast: Double top threatens 0.8220 support
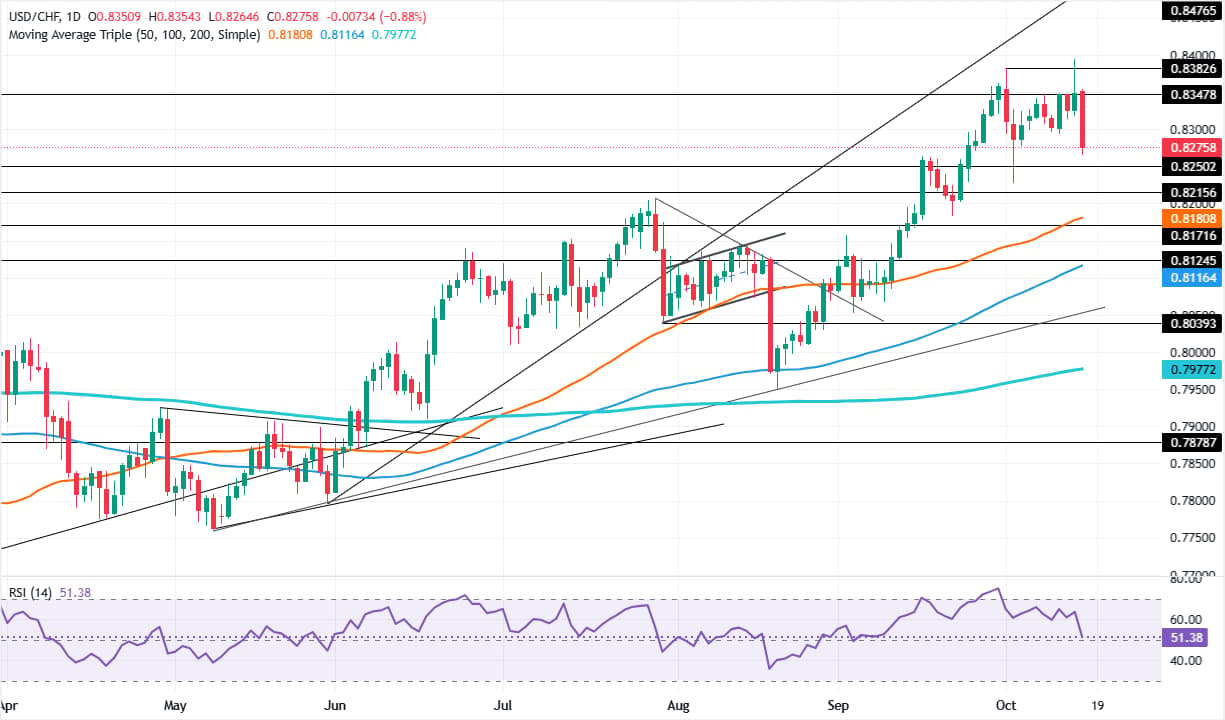
- USD/CHF tumbles below 0.8300 after failing to conquer 0.8400.
- RSI approaches bearish territory, signaling weakening bullish momentum.
- Break below 0.8227 confirms double top, exposing 0.8189 and 0.8116.
The USD/CHF struggles at 0.8350, dives below the 0.8300 figure as a ‘double top’ chart pattern looms in the daily chart, even though the overall trend is up. The pair trades at 0.8269, down almost 1%.
USD/CHF Price Forecast: Technical outlook
The uptrend remains intact, as the market structure of higher highs and higher lows holds so far. Nevertheless, the USD/CHF failed to conquer 0.8400 on Wednesday, exacerbating the pair’s drop below 0.8300.

On the other hand, momentum is shifting in favour of sellers, as indicated by the Relative Strength Index (RSI), with the index trending lower and poised to turn bearish.
Nevertheless, if buyers push the USD/CHF above 0.8300, this paves the way to challenge the 0.8350 psychological level ahead of the yearly high of 0.8395. Once those levels are taken out, it would open the door to challenge 0.8400.
On the flip side, if USD/CHF extends its loss below the October 2 low of 0.8227, this would confirm the ‘double top,’ opening the door for a move towards the 50-day Simple Moving Average (SMA) of 0.8189. The next support is the 100-day SMA at 0.8116.
USD/CHF Price Chart – Daily
Swiss Franc Price Today
The table below shows the percentage change of Swiss Franc (CHF) against listed major currencies today. Swiss Franc was the strongest against the Australian Dollar.
| USD | EUR | GBP | JPY | CAD | AUD | NZD | CHF | |
|---|---|---|---|---|---|---|---|---|
| USD | -0.44% | -0.56% | -0.09% | -0.30% | 0.77% | -0.34% | -0.86% | |
| EUR | 0.44% | -0.13% | 0.34% | 0.12% | 1.23% | 0.09% | -0.43% | |
| GBP | 0.56% | 0.13% | 0.46% | 0.25% | 1.33% | 0.22% | -0.31% | |
| JPY | 0.09% | -0.34% | -0.46% | -0.22% | 0.88% | -0.26% | -0.78% | |
| CAD | 0.30% | -0.12% | -0.25% | 0.22% | 1.07% | -0.03% | -0.56% | |
| AUD | -0.77% | -1.23% | -1.33% | -0.88% | -1.07% | -1.10% | -1.63% | |
| NZD | 0.34% | -0.09% | -0.22% | 0.26% | 0.03% | 1.10% | -0.55% | |
| CHF | 0.86% | 0.43% | 0.31% | 0.78% | 0.56% | 1.63% | 0.55% |
The heat map shows percentage changes of major currencies against each other. The base currency is picked from the left column, while the quote currency is picked from the top row. For example, if you pick the Swiss Franc from the left column and move along the horizontal line to the US Dollar, the percentage change displayed in the box will represent CHF (base)/USD (quote).
BÀI VIẾT PHỔ BIẾN
1China: Constrained but still central to growth – Rabobank2USD/CHF Price Forecast: Double top threatens 0.8220 support3Vietnamese Dong: Trade deal hopes and stable FX – Commerzbank4Gold defies 6.3% US PPI as Treasury yield slide fuels rally5Bitcoin rebounds to $82,000 as PPI hits 6.3%, nearly $1B liquidated6Canadian Dollar hits two-week highs as US Dollar retreats7Singapore Dollar: Range risks against US Dollar after MAS hold – OCBC8Forex Today: Focus shifts to Warsh and more US data9Dollar Index loses its CPI gain as AI stocks slide
GIÁ TRỰC TIẾP


Bắt đầu ngay!
Đăng ký và truy cập Thị trường Toàn cầu trong vòng chưa đầy 3 phút

Kết nối với chúng tôi









Liên hệ
Điện thoại: +61 2 8036 8388
Fax: +61 2 8036 8388
Email: support@tmgm.com
Website: https://www.tmgm.com



Thông tin được cung cấp trên trang web này chỉ mang tính chất chung và không cấu thành lời khuyên tài chính cá nhân. Trước khi hành động dựa trên bất kỳ thông tin nào trên trang web này, bạn nên cân nhắc mức độ phù hợp của thông tin đó với mục tiêu, tình hình tài chính và nhu cầu của mình. Đầu tư vào CFD và Hợp đồng Ký quỹ FX tiềm ẩn rủi ro đáng kể và không phù hợp với tất cả nhà đầu tư. Bạn có thể mất nhiều hơn khoản tiền nạp ban đầu của mình. Bạn không sở hữu hoặc có bất kỳ quyền lợi nào đối với tài sản cơ sở. Chúng tôi khuyến nghị bạn tìm kiếm tư vấn độc lập và đảm bảo rằng bạn hiểu đầy đủ các rủi ro liên quan trước khi giao dịch. Điều quan trọng là bạn phải đọc và cân nhắc tài liệu công bố thông tin trước khi mua bất kỳ sản phẩm nào được liệt kê trên trang web. Thông tin và quảng cáo được cung cấp trên trang web này không nhằm mục đích sử dụng bởi bất kỳ cá nhân nào tại bất kỳ quốc gia hoặc khu vực pháp lý nào mà việc sử dụng đó sẽ trái với luật pháp và quy định địa phương. Các Sản phẩm và Dịch vụ được cung cấp trên trang web này không dành cho cư dân Hoa Kỳ, Malaysia và Thái Lan.
TMGM được ủy quyền và quản lý tại nhiều khu vực pháp lý khác nhau.
Trademax Australia Limited, giao dịch dưới tên TMGM, được quản lý bởi Ủy ban Chứng khoán và Đầu tư Úc (ASIC), AFSL số 436416 và có trụ sở tại Tầng 28, One International Tower, 100 Barangaroo Avenue, 2000 Sydney, NSW Australia.
Email: support@tmgm.com.au
Trademax Global Limited, giao dịch dưới tên TMGM, được ủy quyền và quản lý bởi Ủy ban Dịch vụ Tài chính Vanuatu (VFSC), số đăng ký 40356 và được đăng ký tại 1276, Kumul Highway, Port Vila, Vanuatu, Cộng hòa Vanuatu.
Email: support@tmgm.com
Trademax Global Markets (SE) Limited, hoạt động dưới tên TMGM, được ủy quyền và điều chỉnh bởi Cơ quan Dịch vụ Tài chính (FSA) của Seychelles, với số giấy phép SD224. Công ty đăng ký tại Văn phòng số 13, Providence Estate ABIS Centre, Mahe, Seychelles.
Email: support@tmgm.com
Trademax Global Markets (International) Pty Ltd, giao dịch dưới tên TMGM, được ủy quyền và quản lý bởi Ủy ban Dịch vụ Tài chính, Mauritius (FSC) với giấy phép số GB22201012, và được đăng ký tại 33, Edith Cavell Street C/o IQ EQ Fund Services (Mauritius) Ltd Port Louis, 11324 Mauritius.
Email: support@tmgm.com
Bản quyền © TMGM. Tất cả quyền được bảo lưu